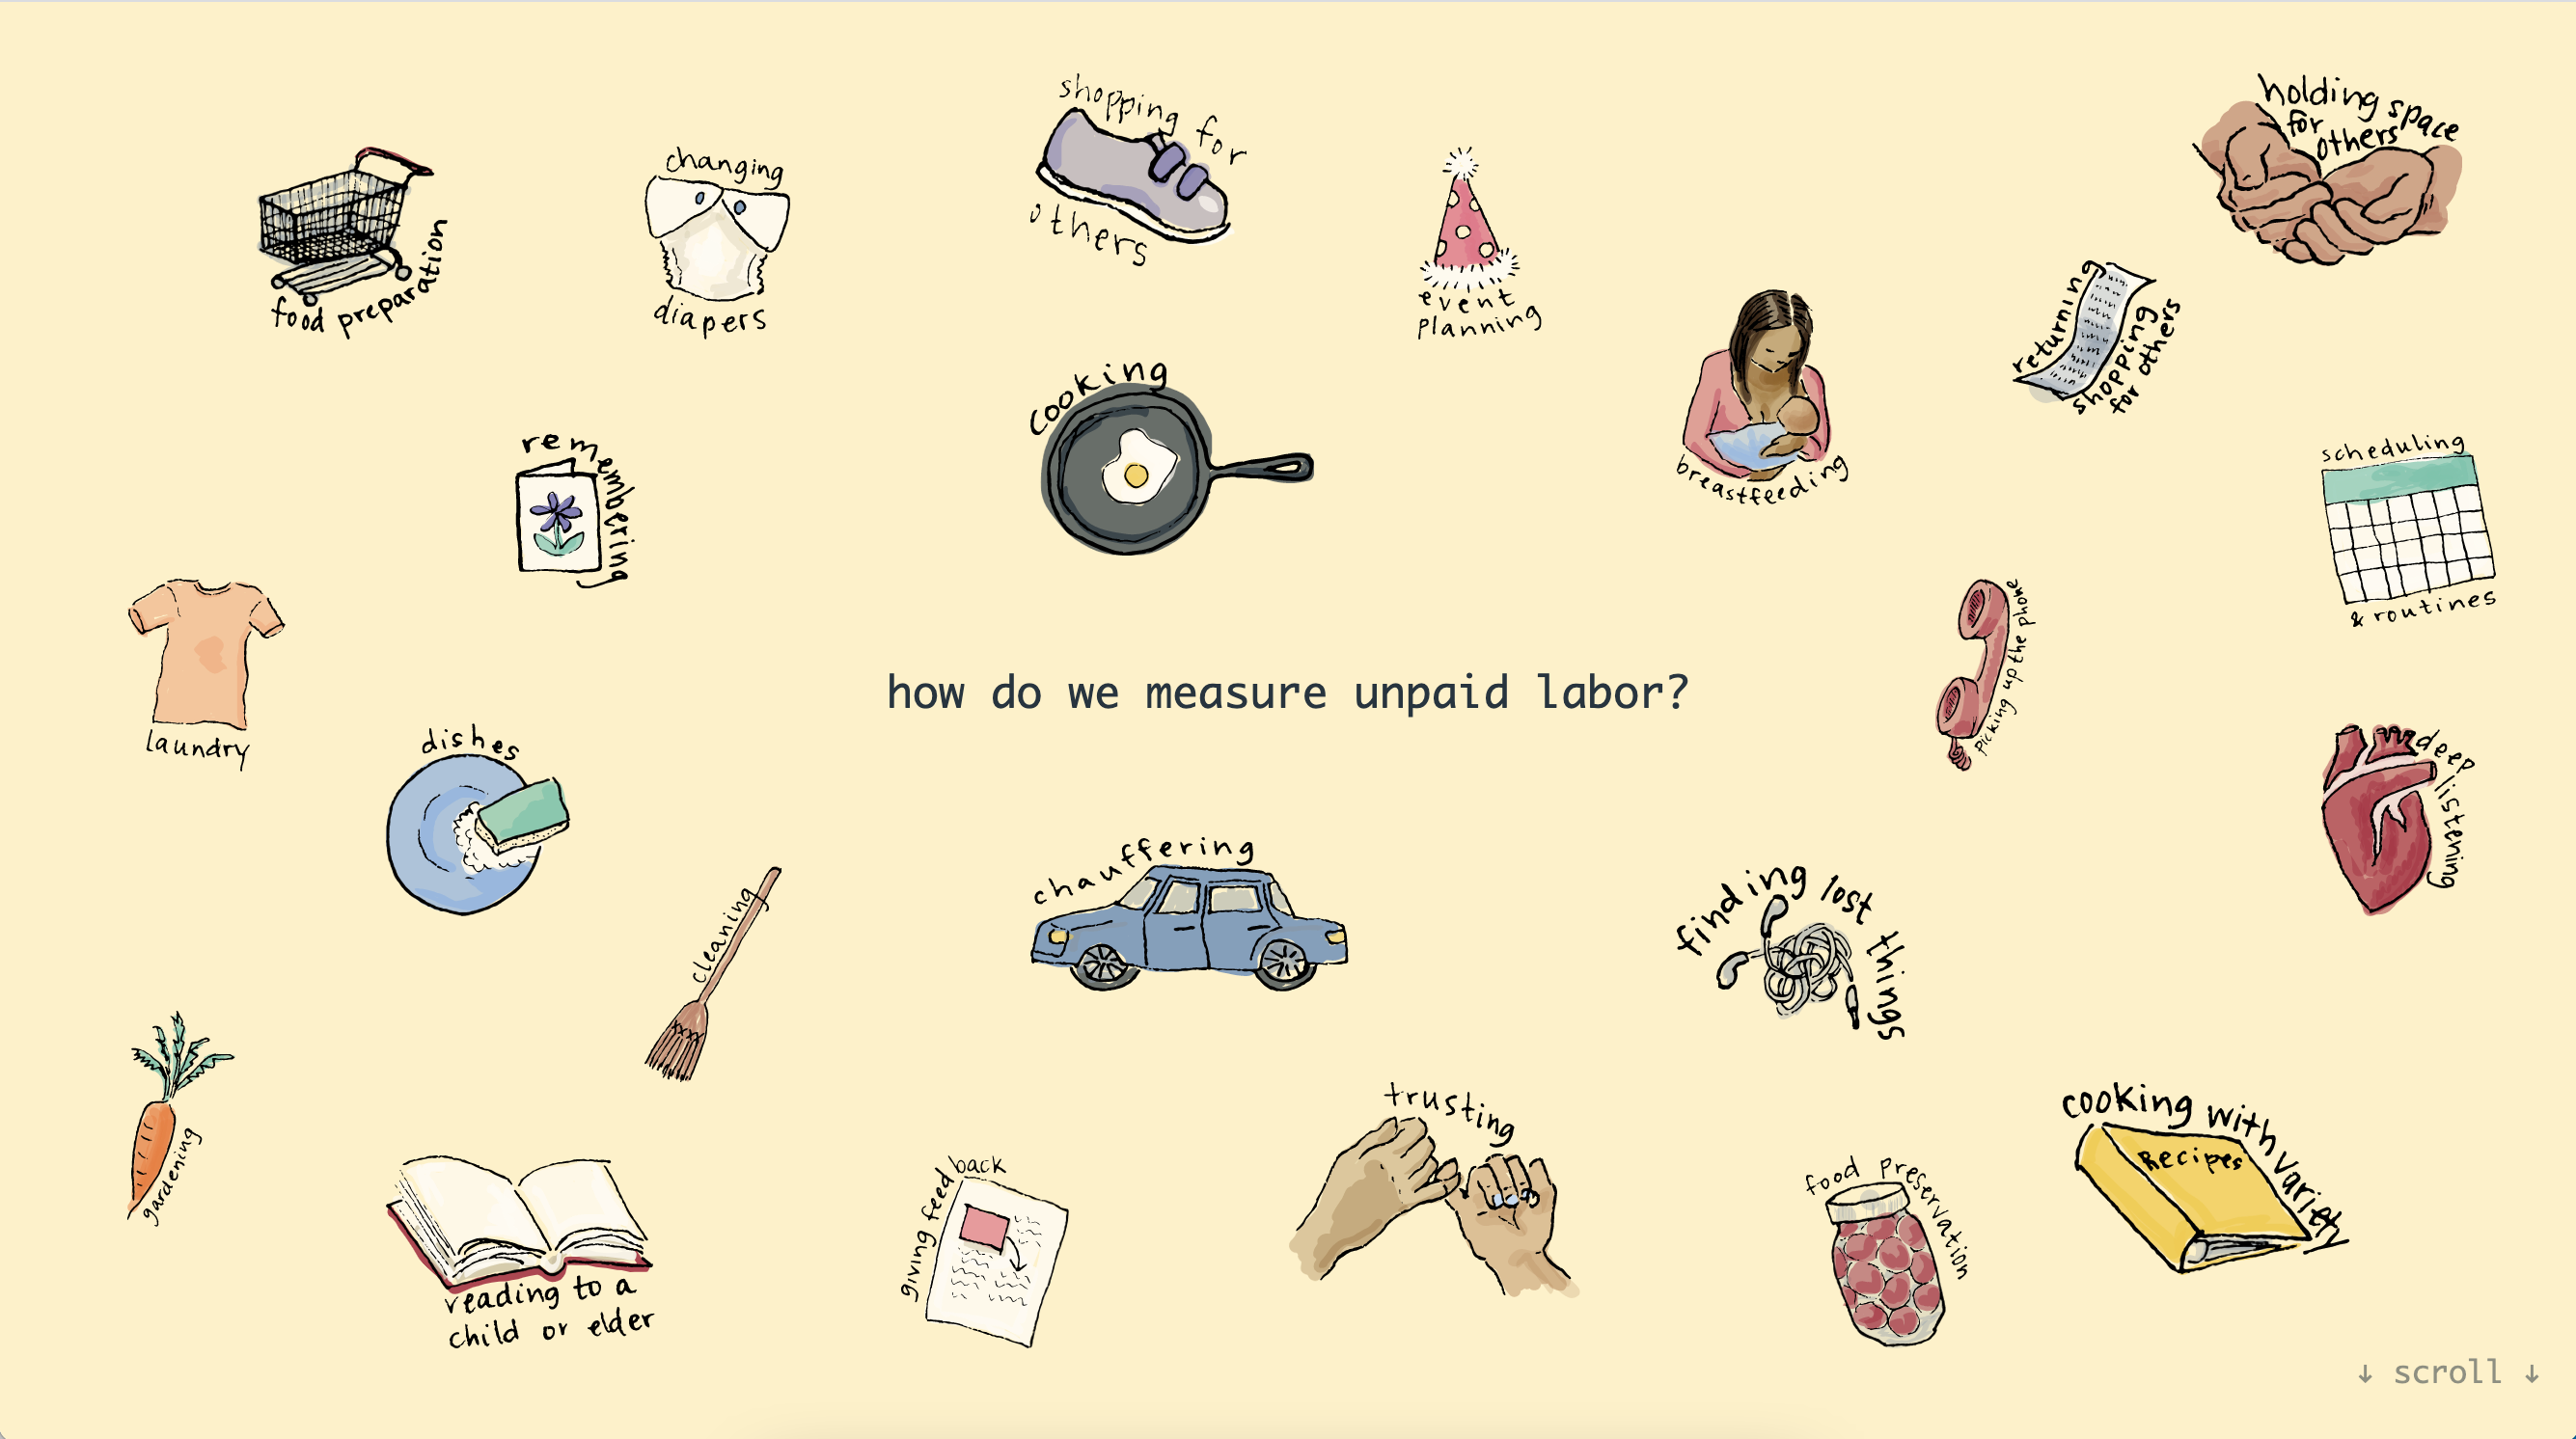
Making Space for Unquantifiable Data
pen + paper | Illustrator | HTML | CSS | d3.js
follow-up thoughts in DVS Nightingale
Cognitive Load as a Guide: 12 Spectrums to Improve Your Data Visualizations
co-authored with Erin Waldron
published in Nightingale, September 2021
featured on
Best of the Visualisation Web
September 2021
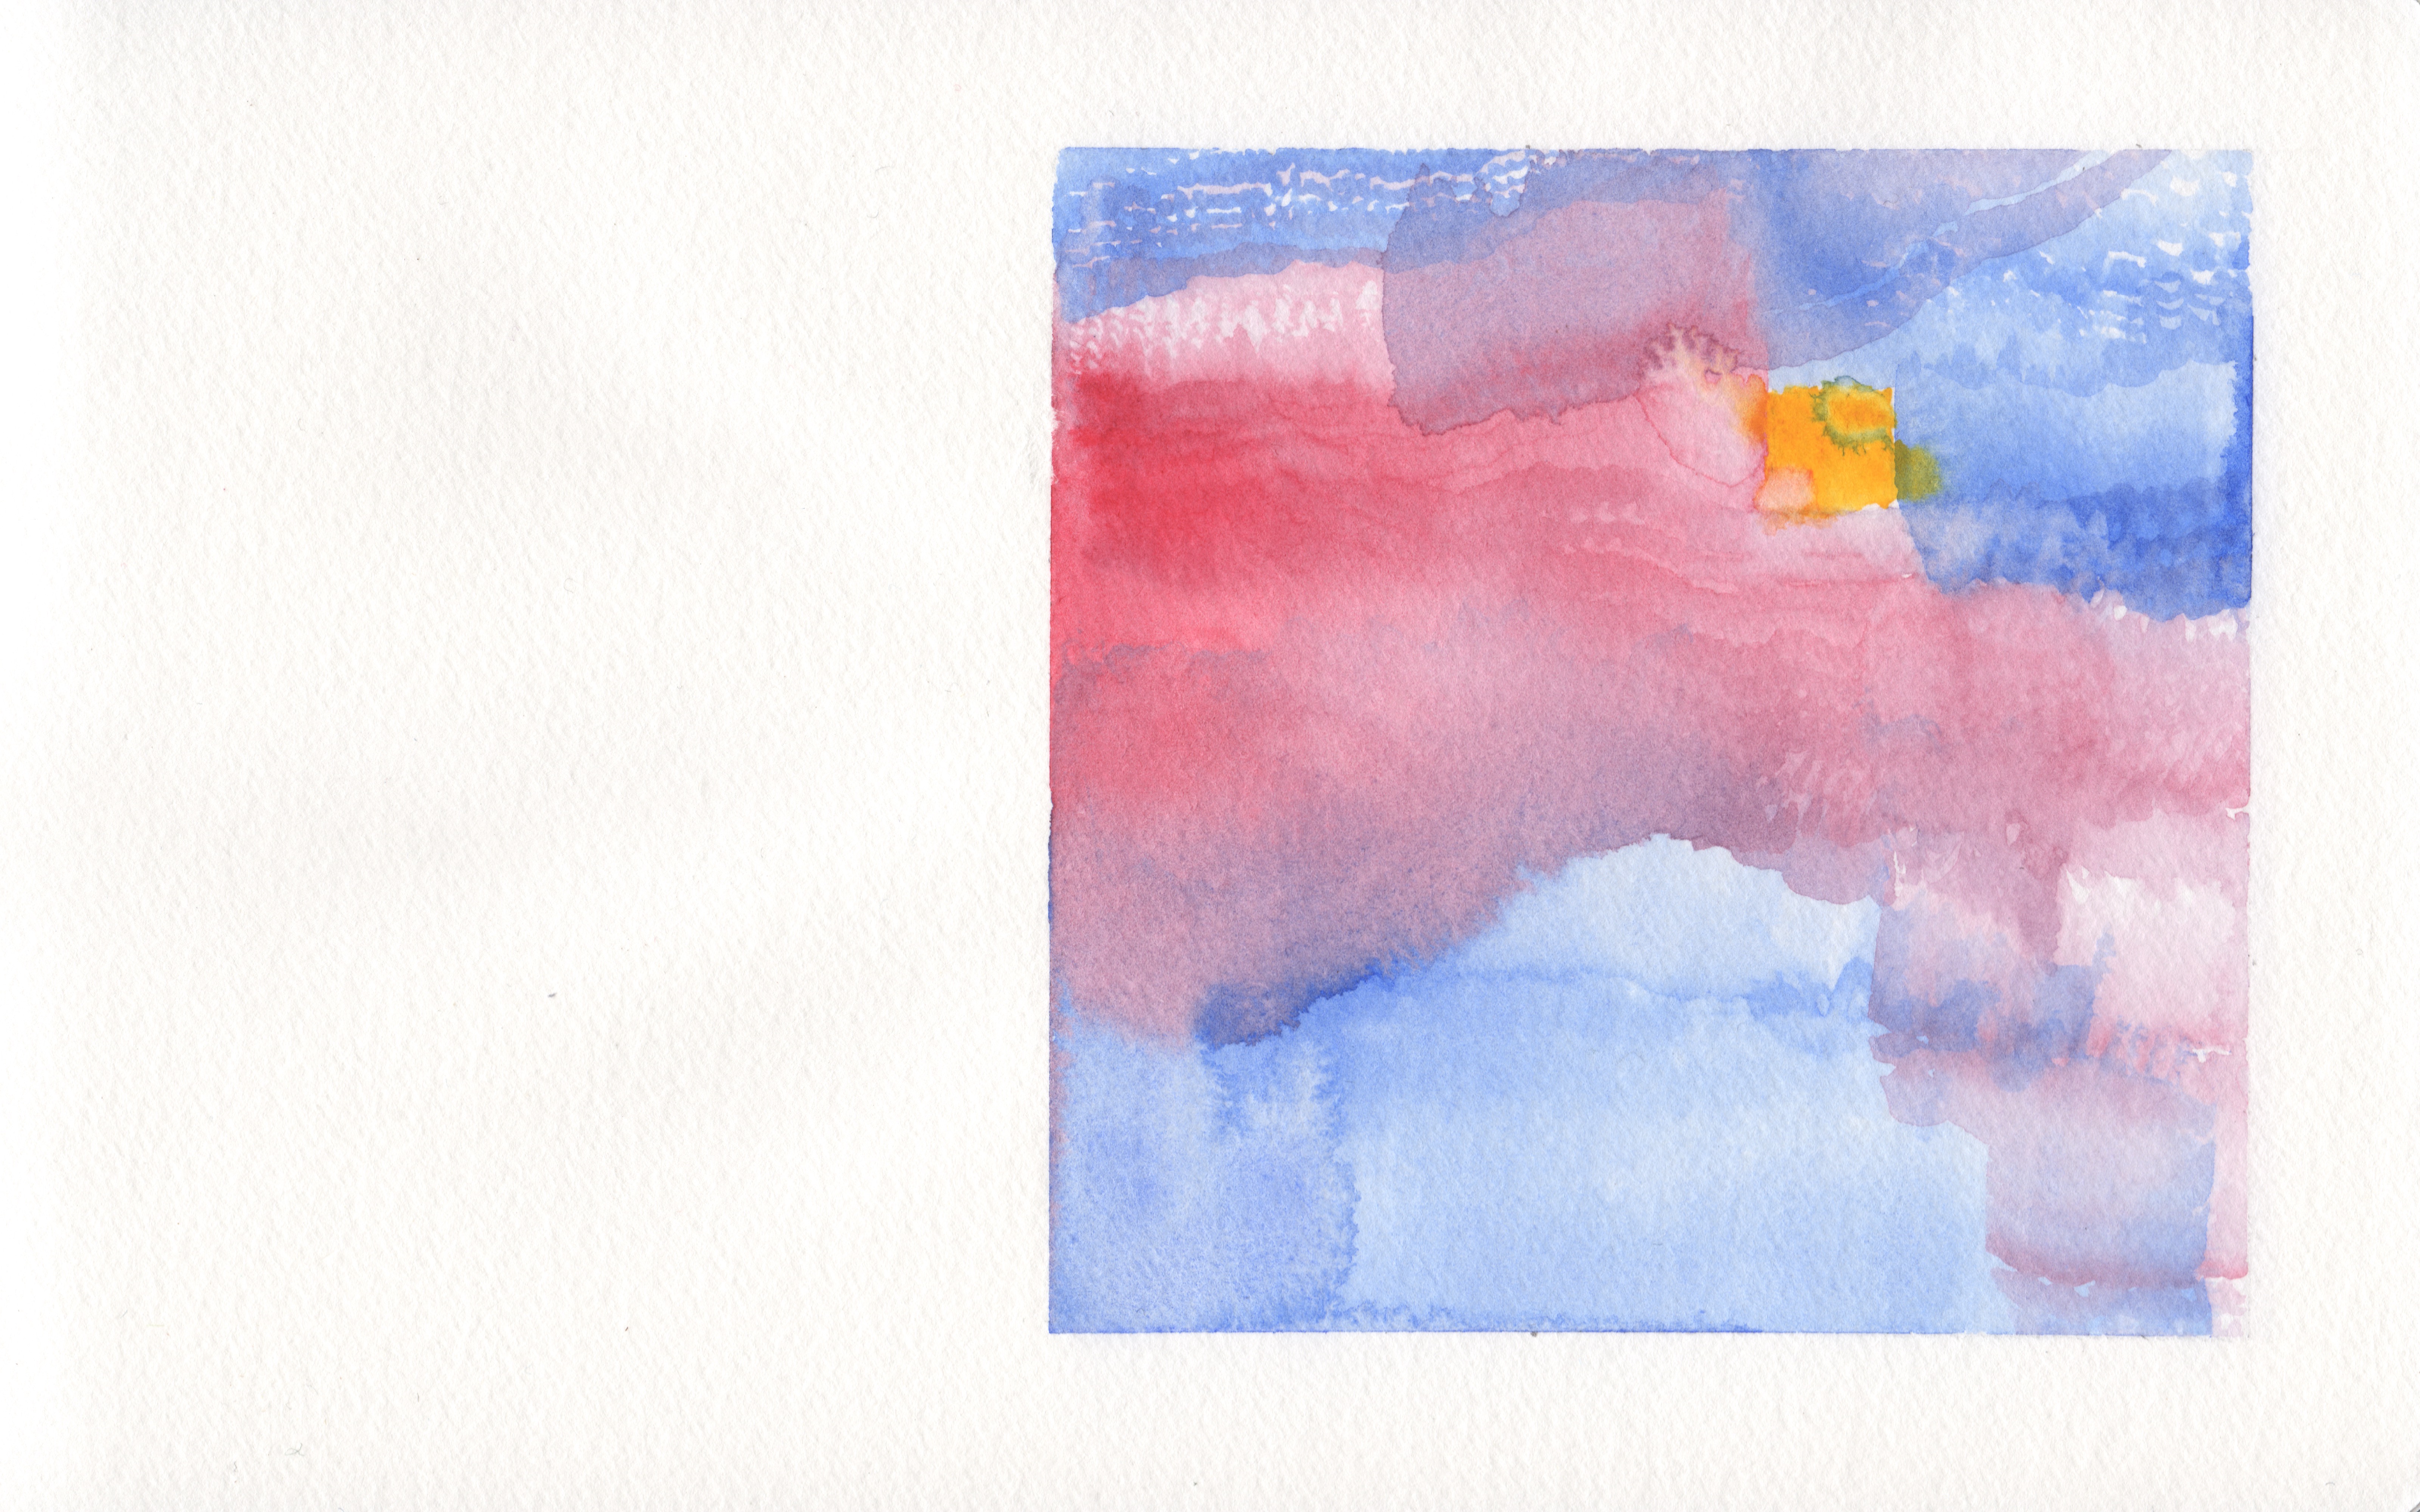
The Case for Watercolor Data Viz
watercolor paint
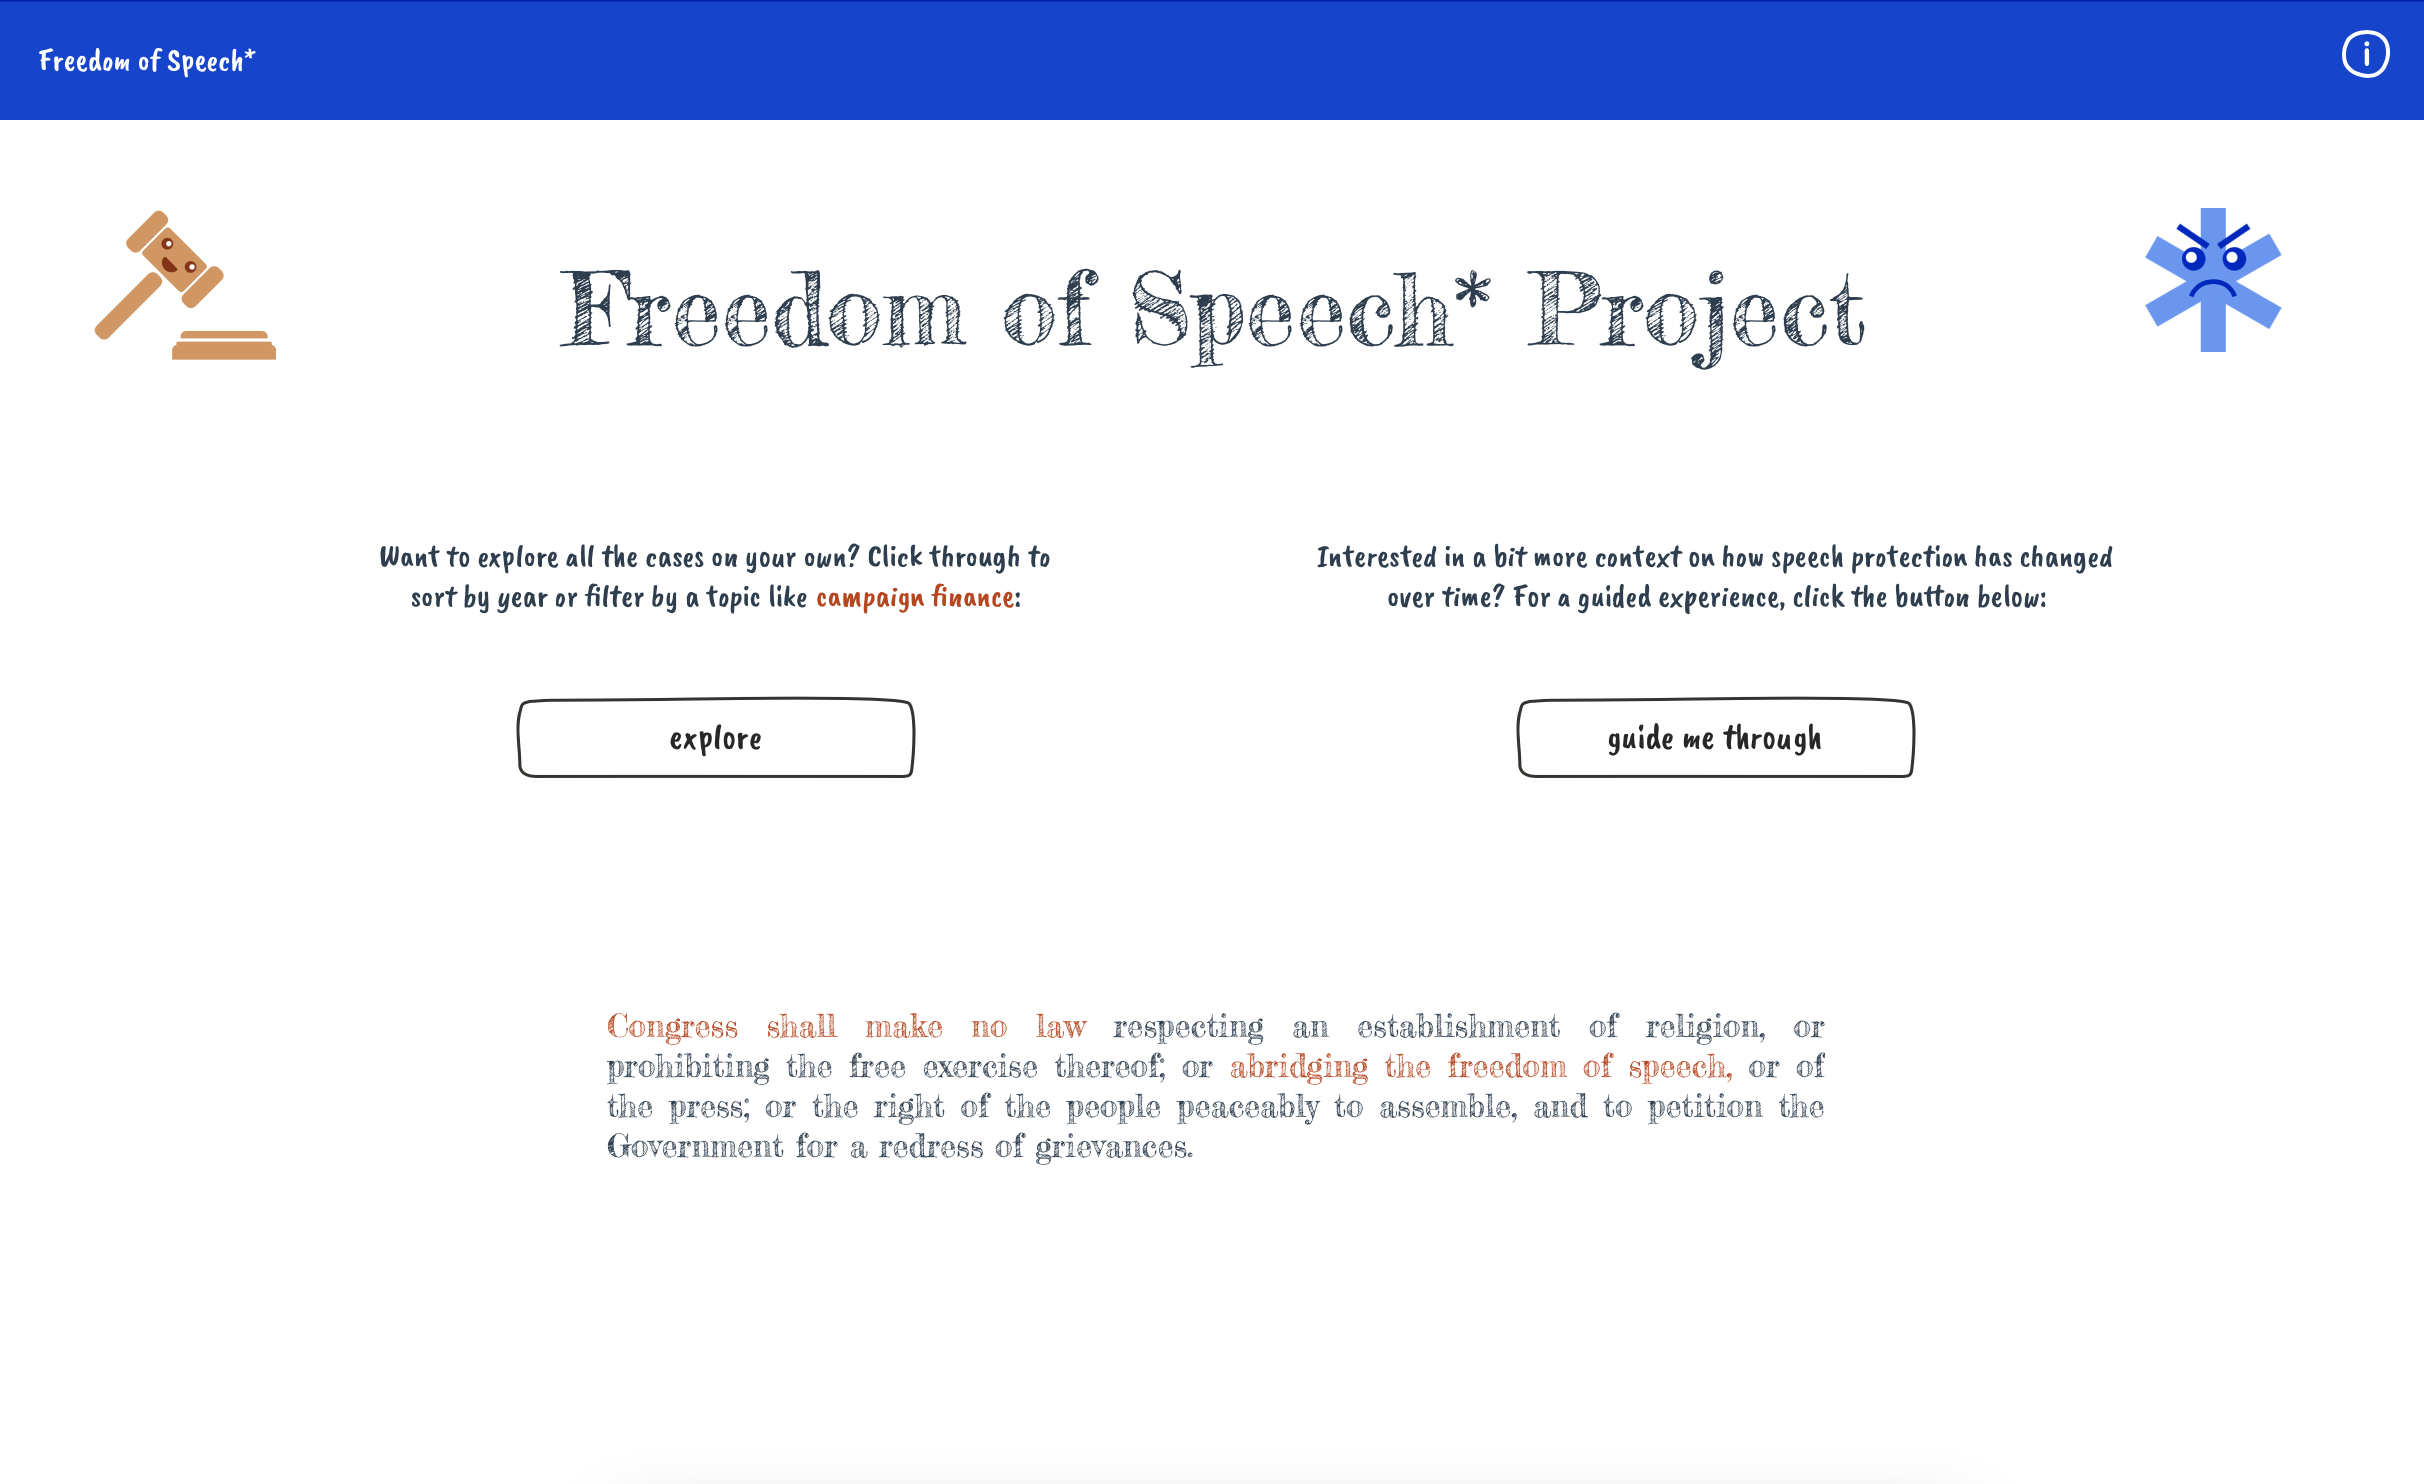
Freedom of Speech* Project
Python | R | js | Vue | d3.js
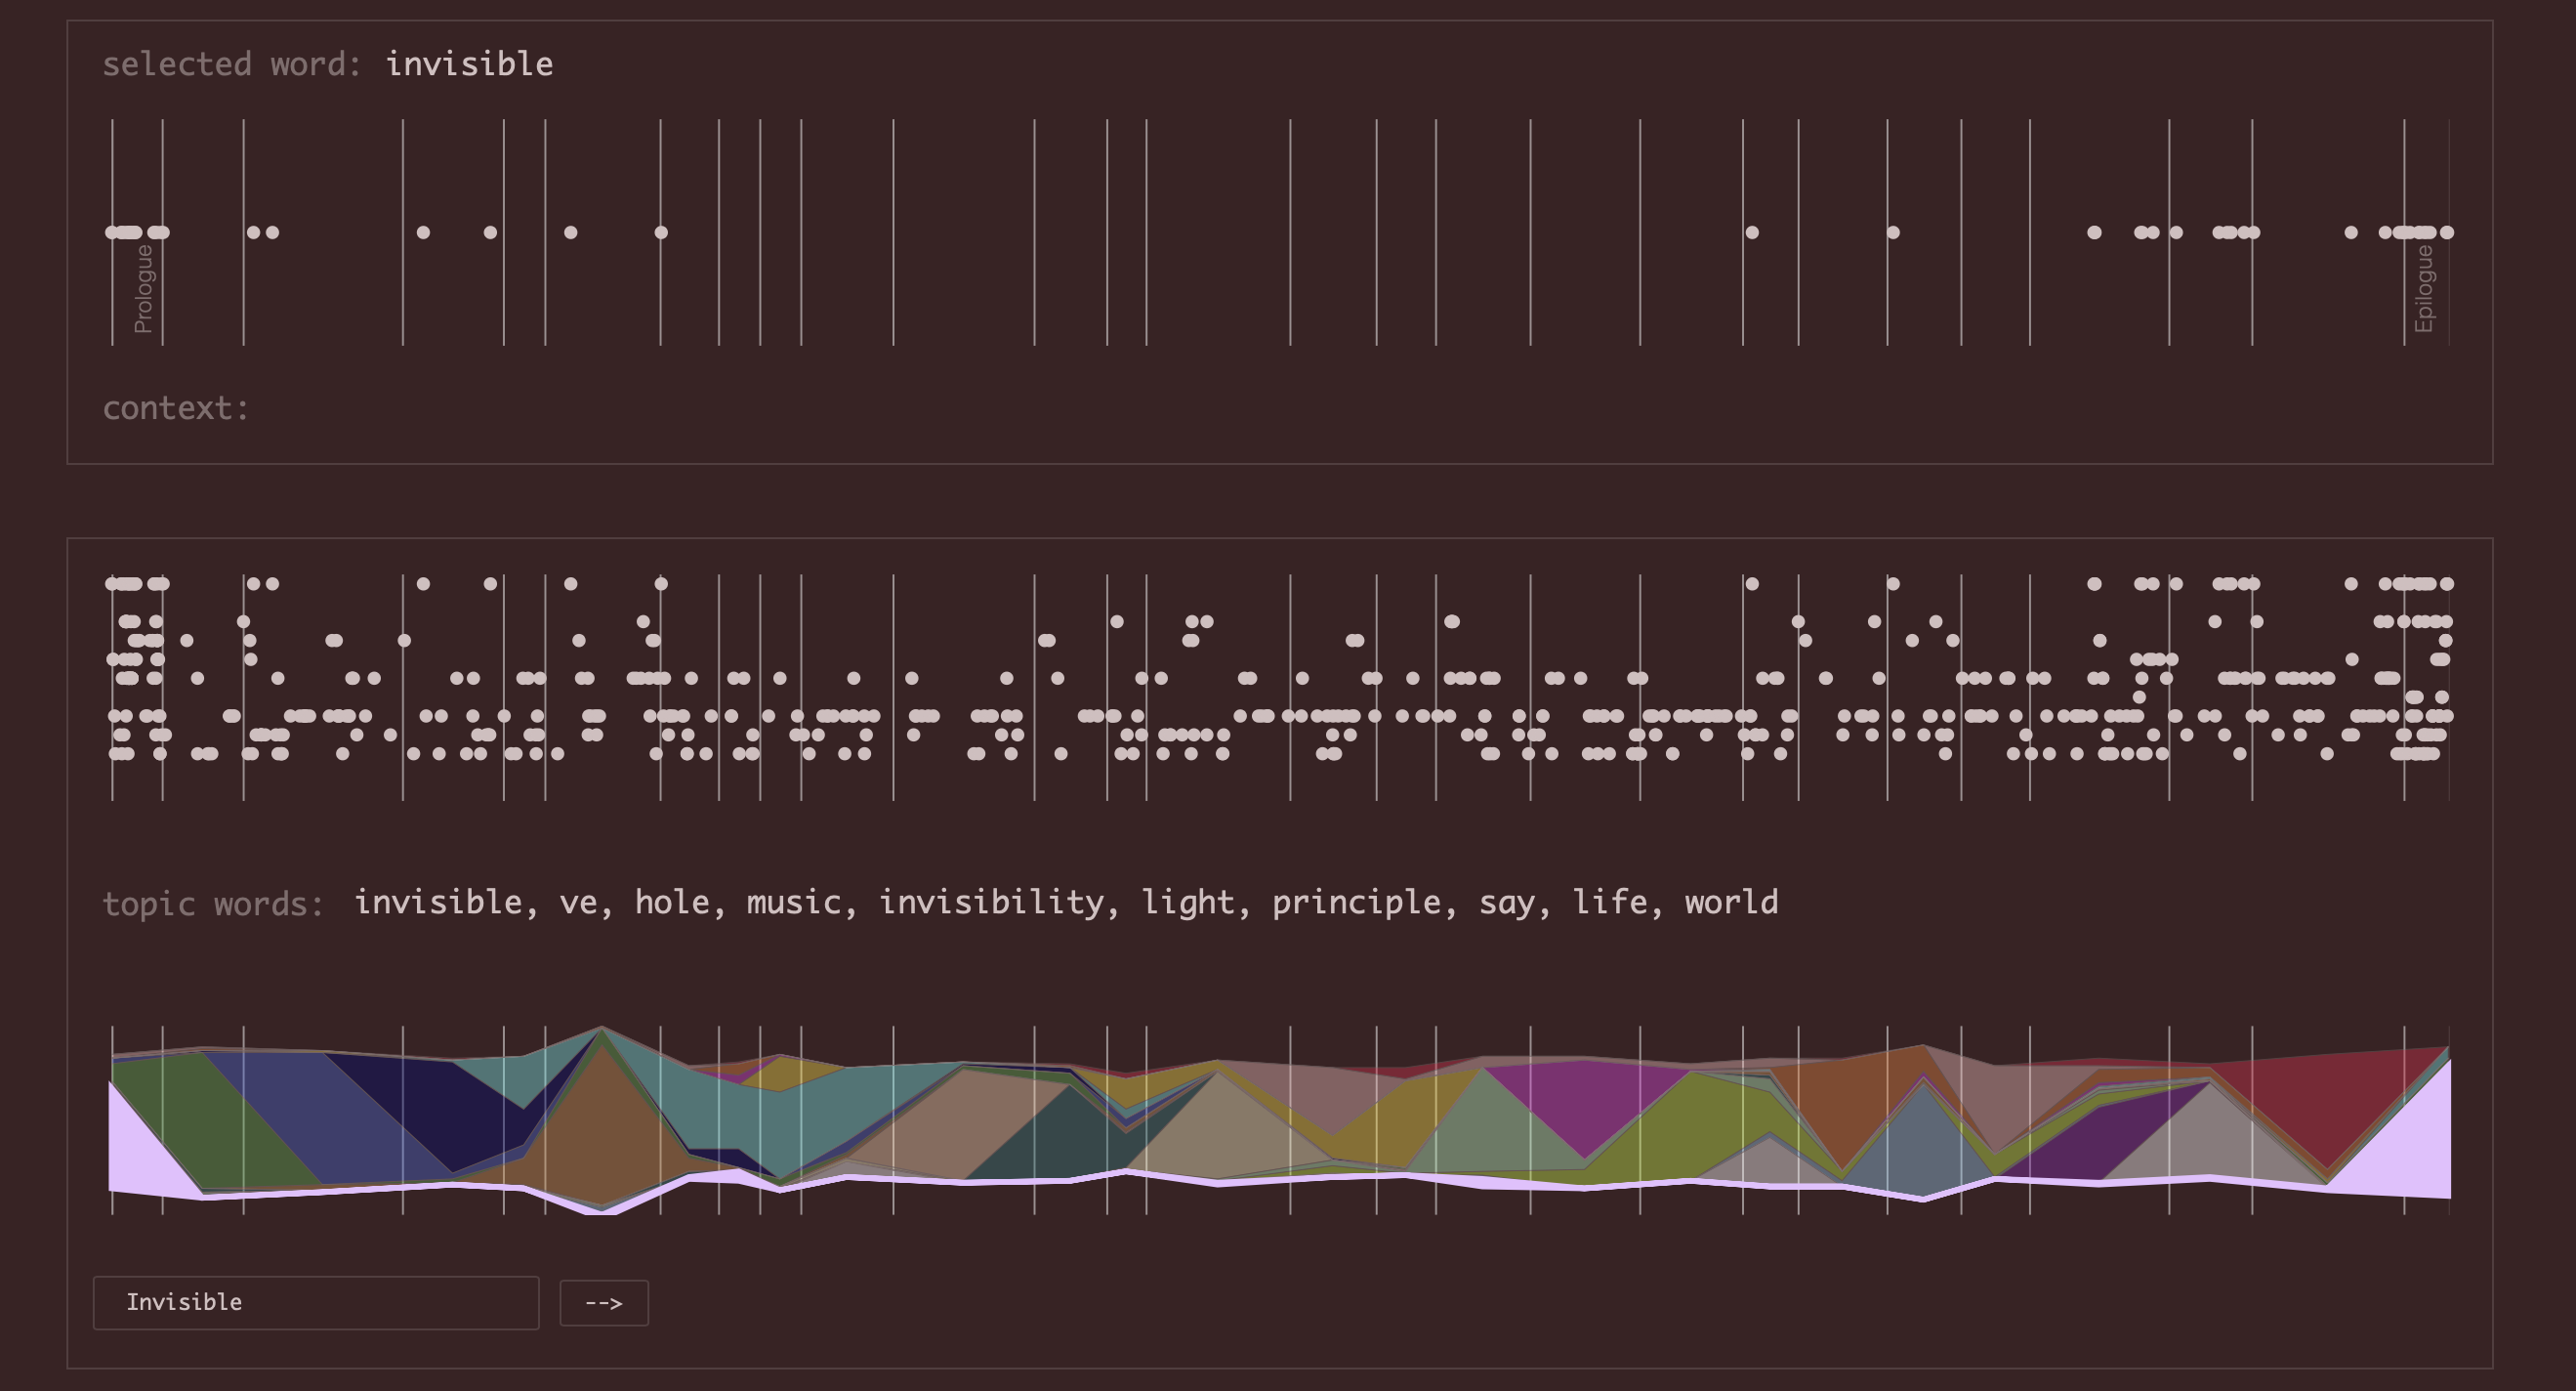
On the Lower Frequencies:
an exploratory concordance tool for
Invisible Man
R | d3.js | HTML | CSS | Parcel
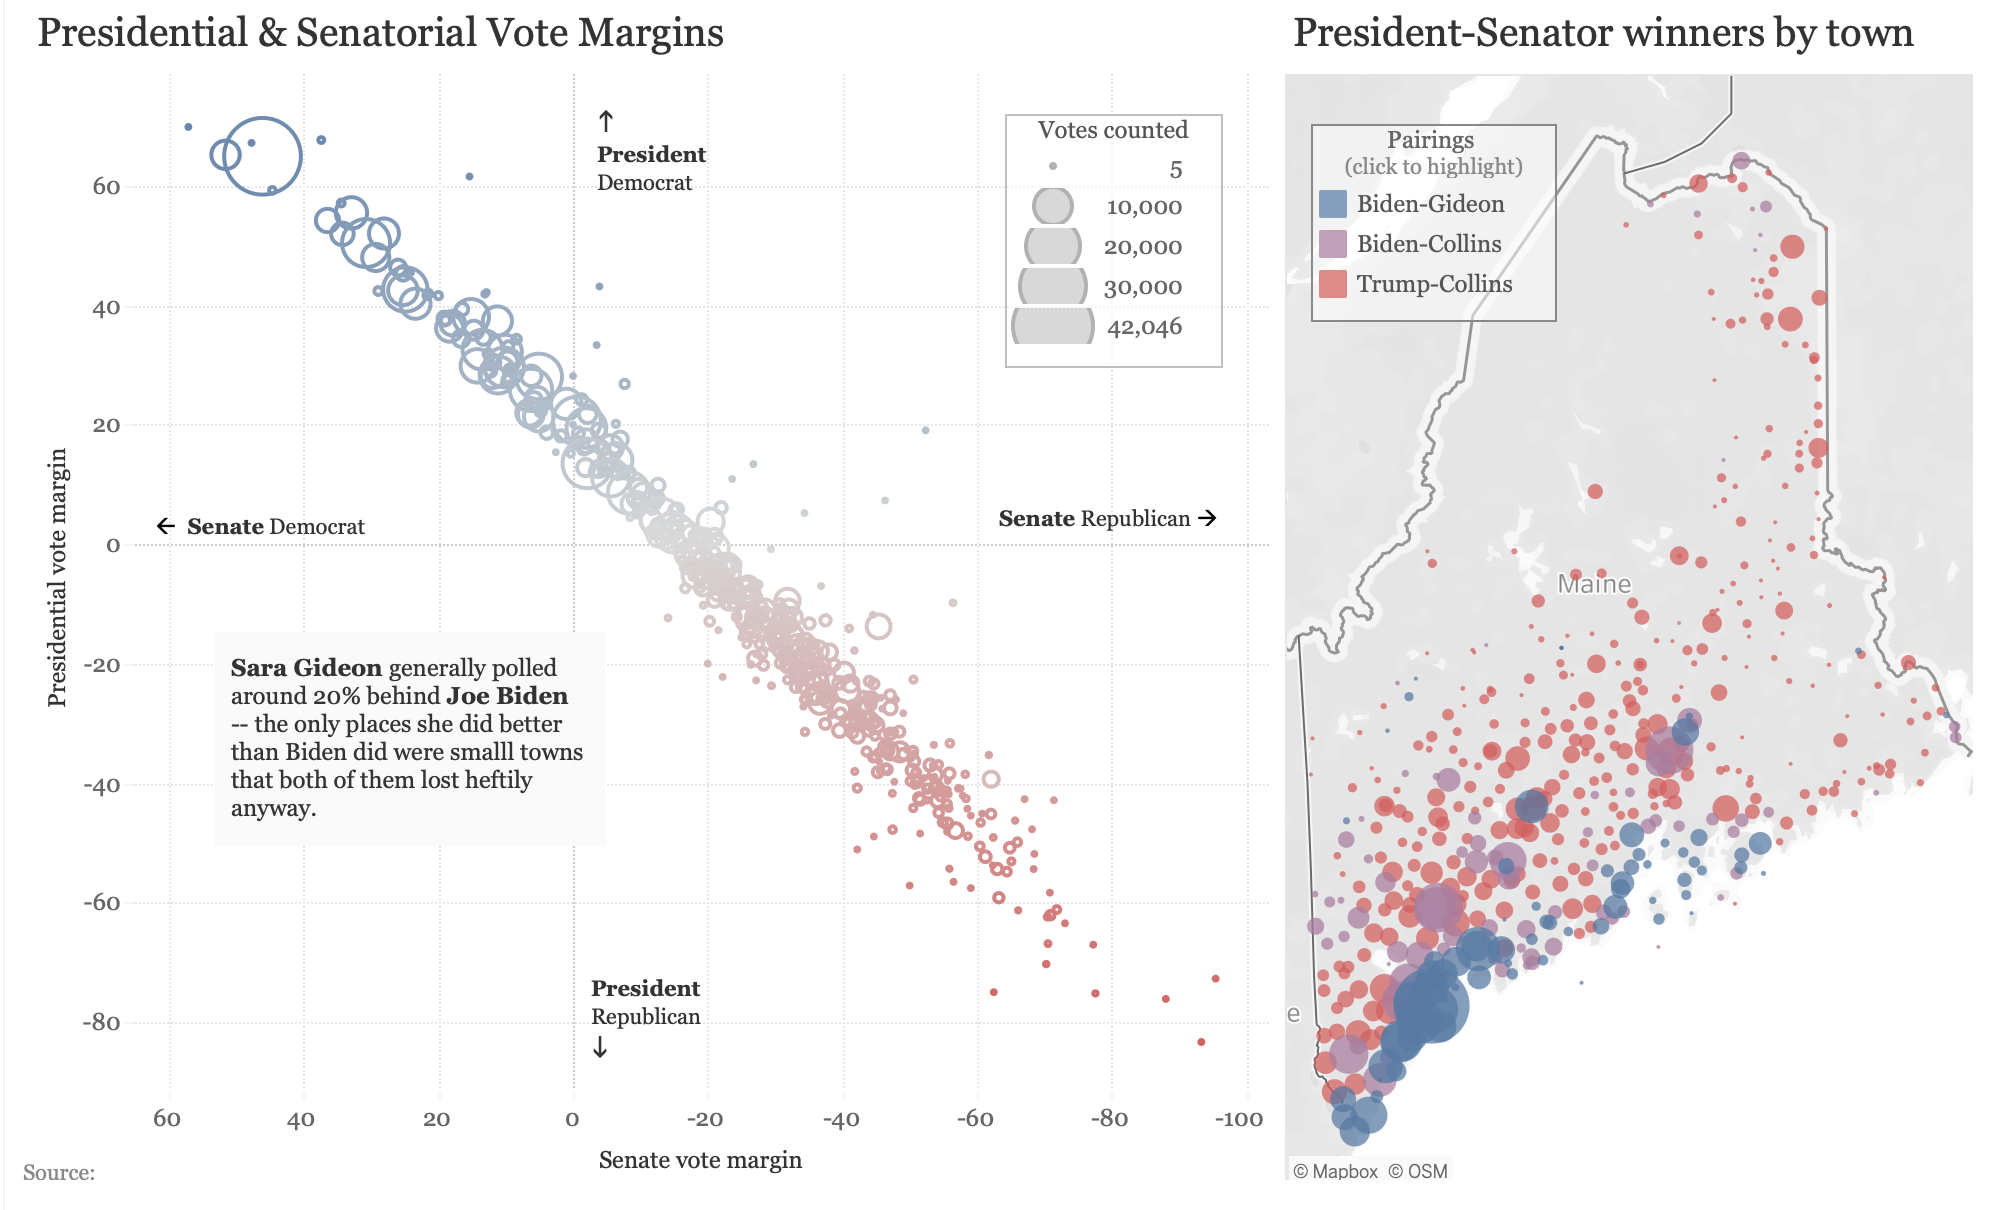
A Split Vote: Maine 2020
Tableau
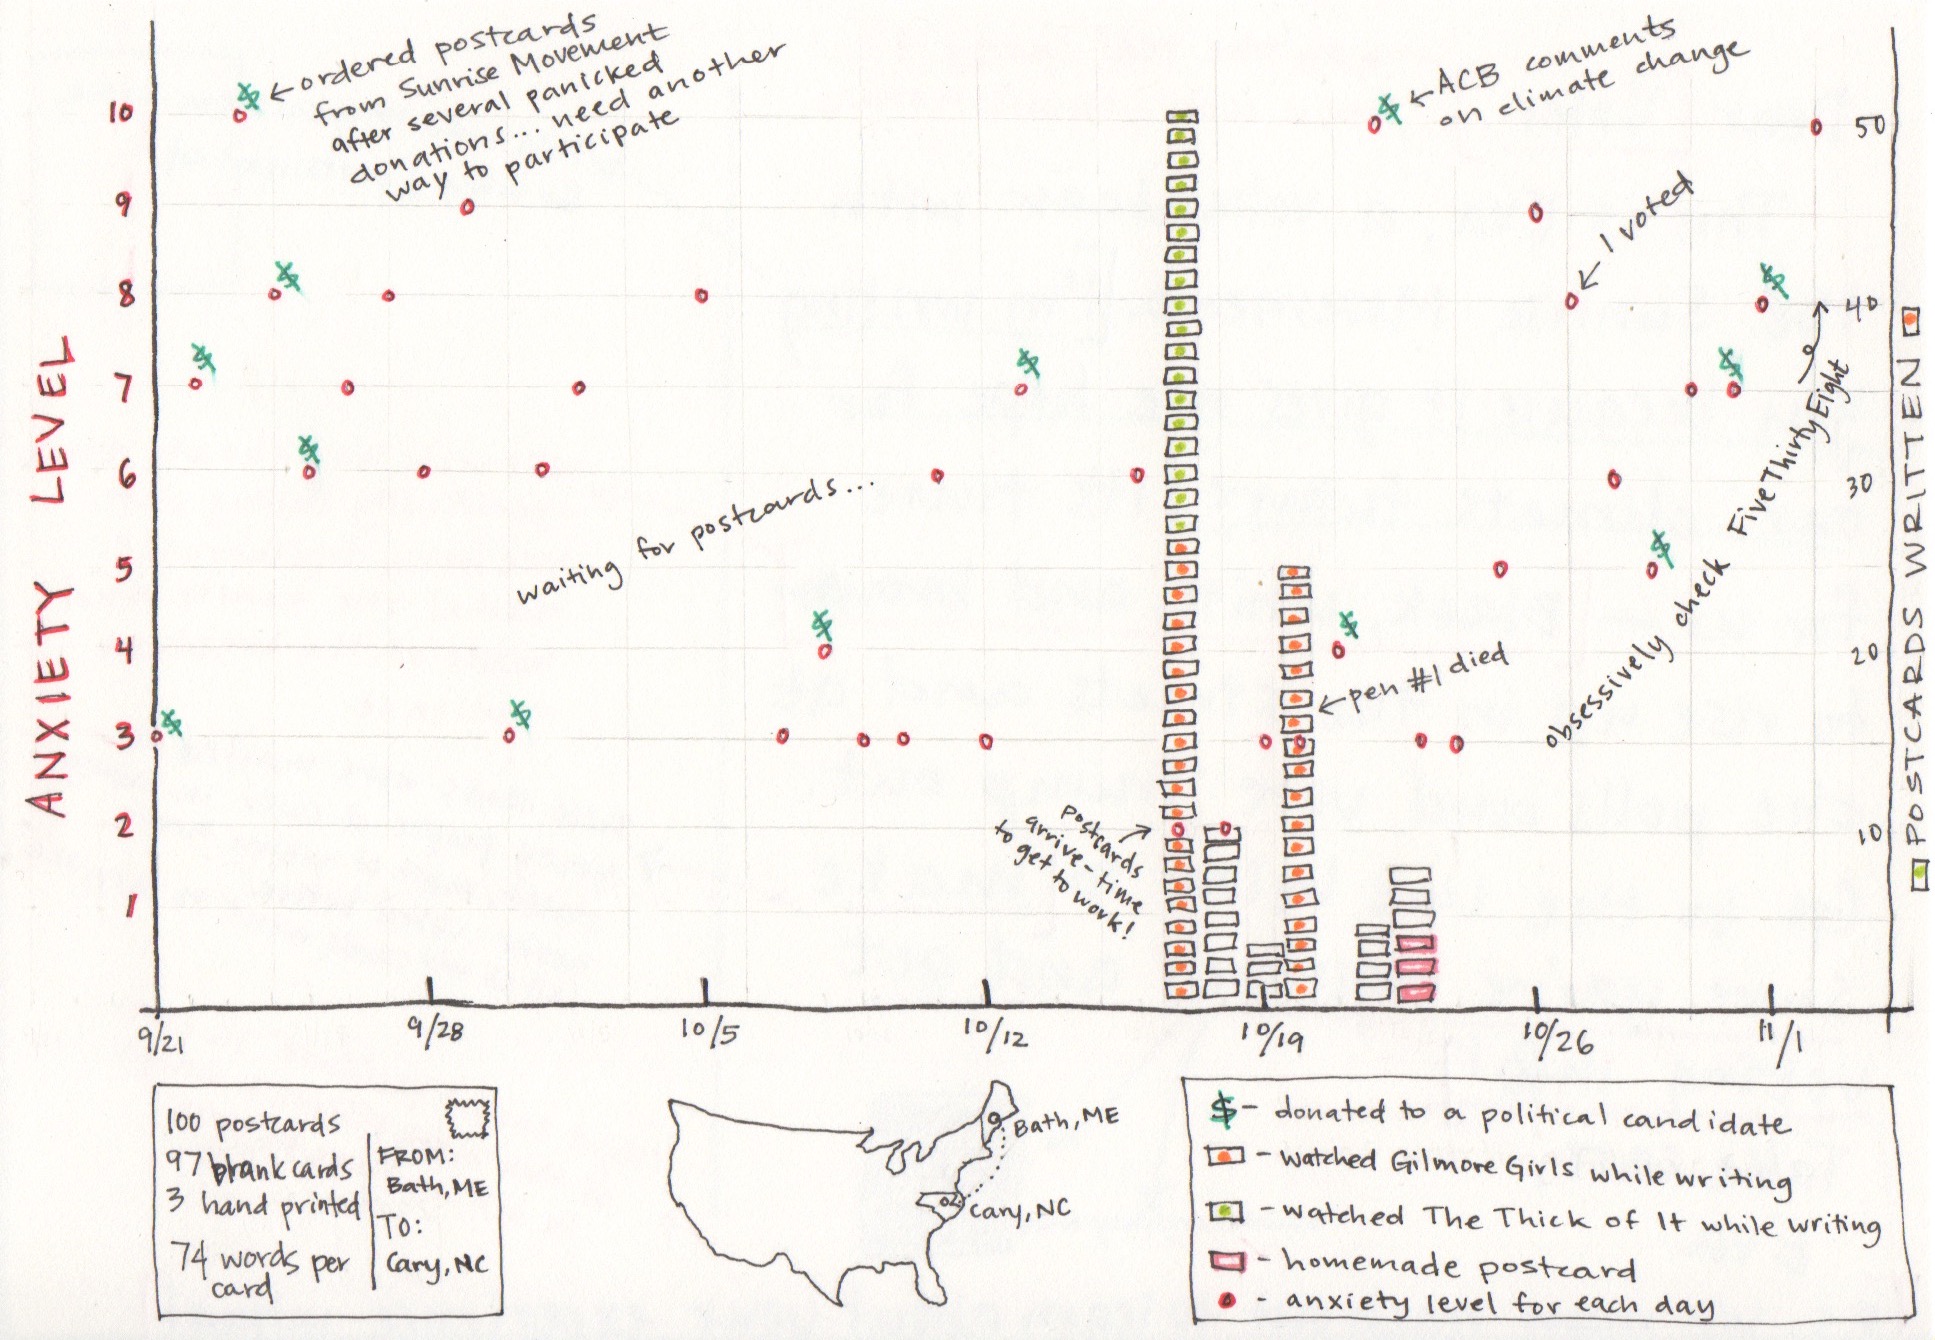
Countdown to November 3
pen & postcards | linoleum block print
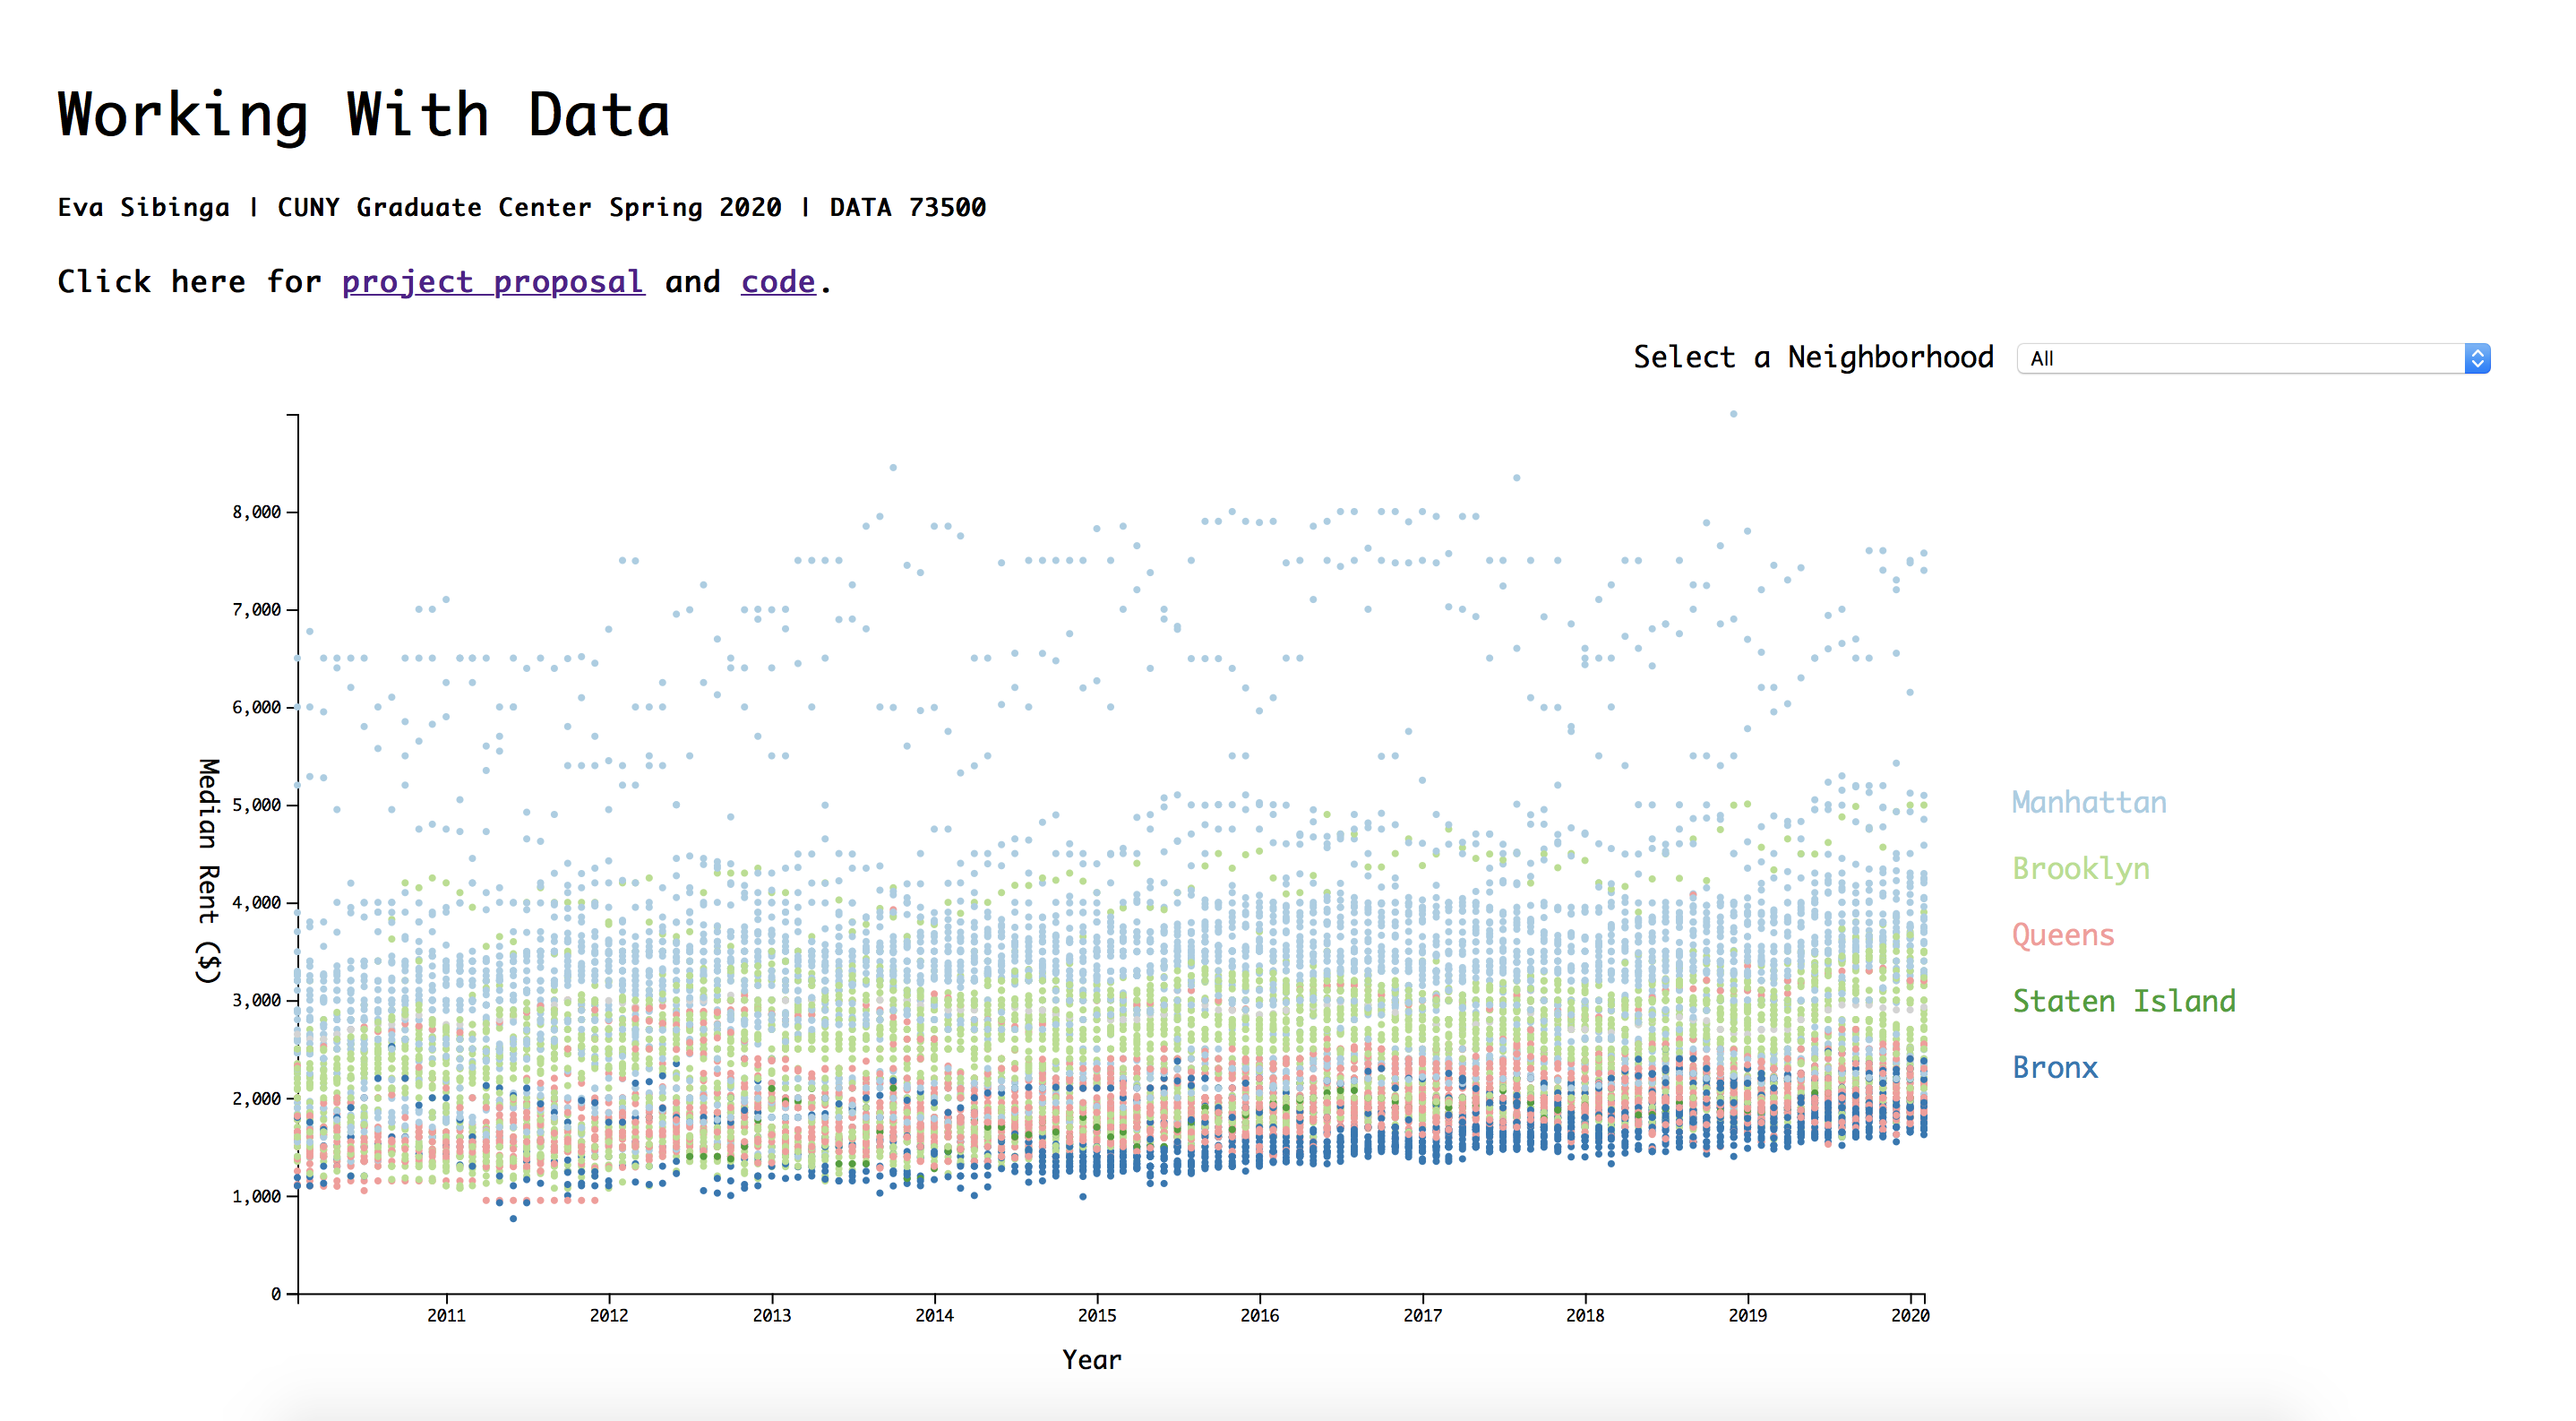
StreetEasy NYC Median Rent exploration
Python | d3.js | HTML | CSS
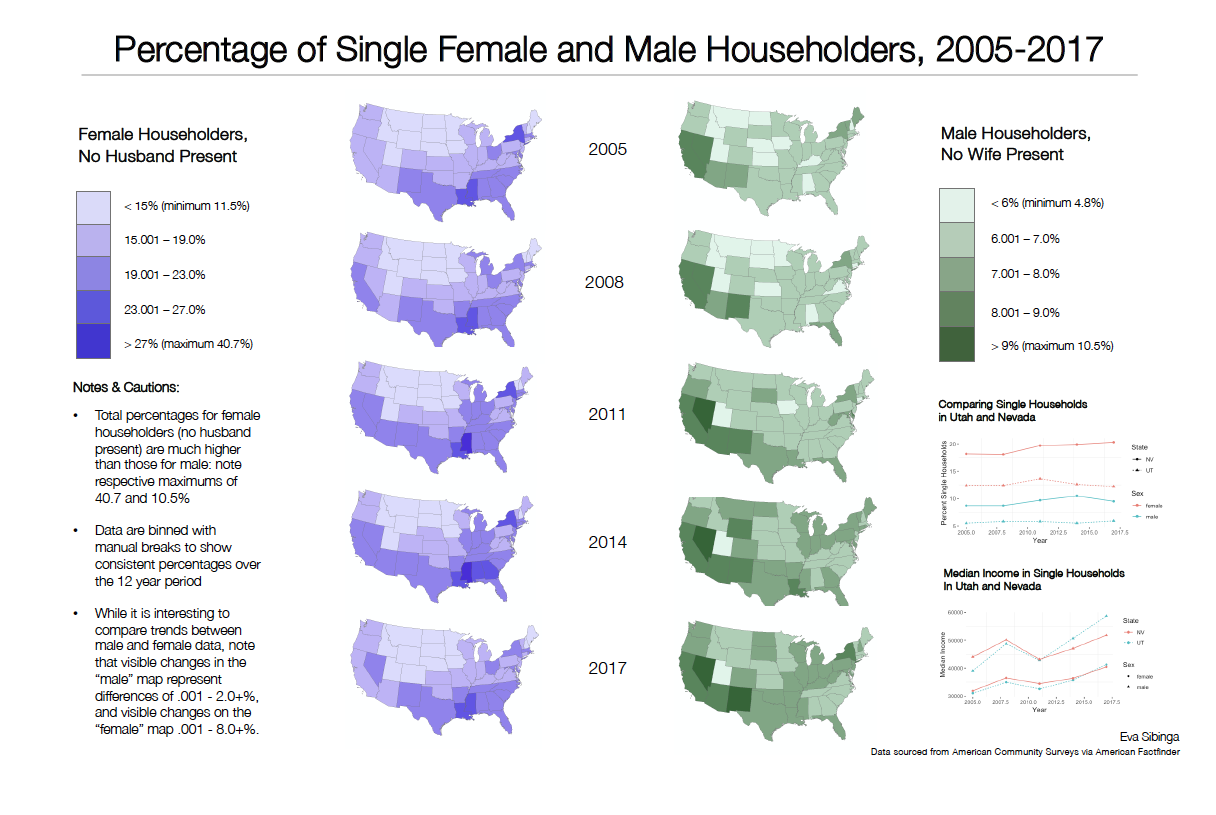
All the Single Ladies Go To Mississippi,
and Married Men Go to Utah
ArcGIS | American FactFinder | R